Exposure and the Histogram
Posted: August 20th, 2014 | Tags: Photography • Tutorials | Posted in: Photography, TutorialsIf you’re new to photography you’ll probably hear things like “underexposed”, “overexposed”, “clipping”, “blown highlights”, “blocked up shadows”. Yep, I agree, they are confusing at first, and this isn’t made any easier when people can’t really explain what an under or over exposed photo looks like when you ask them.
Thankfully there’s a simple tool to help you understand what these photography slang terms mean, and how you can tell if your images are properly exposed. It’s called a histogram, and it looks a bit like this:
Note: Before I start waffling on about the histogram, excuse the diagrams, I drew them, so they’re pretty rough and meant for illustrative purposes only! :)
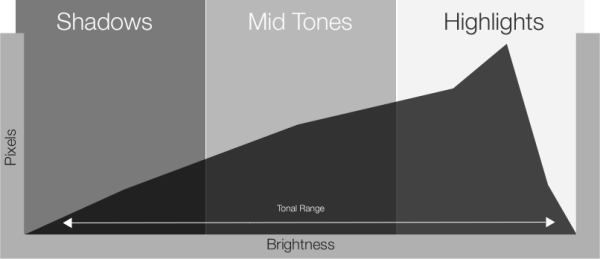
As you can see, a histogram is really just a graph, and a very simple one at that! The Y axis (vertical) represents the number of pixels (the dots that make up your images), and the X axis represents the brightness of the pixels, going from black (shadows) on the left to white (highlights) on the right, with the mid tones between — white to the right… that’s easy to remember! In a nutshell the histogram gives you an overview of the tonal range of your image, or simply put, the range of tones from black to white within your image.
Have a look at your camera manual to find out how to display the histogram for images as you take them.
Let’s now have a look at how a histogram may look when images are overexposed or underexposed.
Overexposure
If you remember the phrase “white to the right” then determining overexposure from the histogram is made quite simple. The graph will be weighted towards the right, due to the high number of pixels within your image being bright.
A heavy bias towards the right doesn’t automatically mean overexposure though, it just means that there’s a lot of white (highlights) in your image. For example, if you take a photo of snow-covered mountains, with a snow-covered foreground, the histogram is going to have a strong bias towards the right edge — it’s not overexposed, it’s just white.
So, how do you tell if the snow is overexposed? Well, overexposure means that there is solid white in the image — or, what’s commonly referred to as “highlight clipping”. Highlight clipping is simply a way of describing parts of the image beyond what the camera is capable of capturing, solid white areas with no texture or detail. If you look at snow, you can normally pick out the texture of its crystalline surface, unless there is strong sunlight reflecting from it. Snow doesn’t look like a flat white mass, and it shouldn’t look like a flat white mass in your photo, either. If it does indeed look like a flat white mass in your photo, then you have lost highlight detail due to highlight clipping.
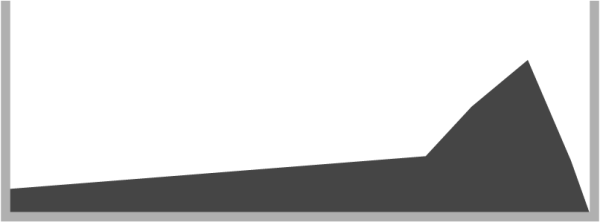
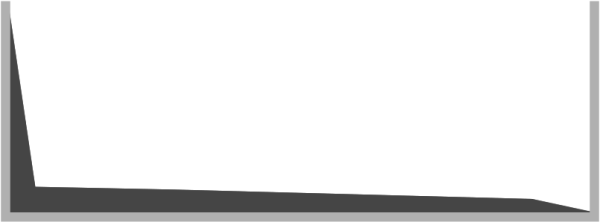
The problem is that it’s not easy to tell from the tiny LCD on the back of your camera whether or not the snow has retained the texture and detail it’s supposed to have, and that’s where looking at the histogram comes into play. Highlight clipping is represented clearly in the histogram when it displays a graph with a bunching of pixels creeping up the right edge of the graph, like this:
The solution to this is simple: use exposure compensation to bring the highlights back within the limits of the histogram. The image may look a bit weird on your LCD after doing this, but at least you’ll have all the detail you need when you come to edit your image later.
Underexposure
Remembering the phrase “white to the right” brings us to the fairly obvious conclusion that the opposite is going to apply to black. A lot of black (shadow) in an image is going to be represented in the histogram by a weight of pixels biased toward the left of the graph.
As with highlights, a lot of black in the image doesn’t automatically mean that your image is underexposed — it just has a lot of black in it, or lots of shadow area.
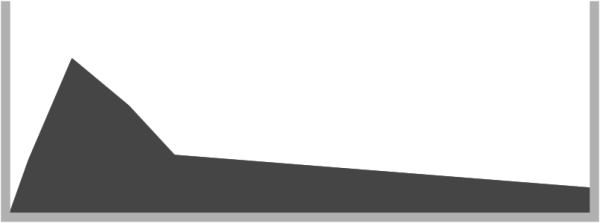
When looking for underexposure we are again looking for a bunching up the edge of the histogram graph, but this time the bunching will be to the left, where shadows are represented. If you have a bunching of pixels creeping up the left edge of the histogram this means you have areas of solid black within your image, and those solid black areas hold no detail of what’s lurking there.
Sometimes this is fine, because it’s not always essential for the viewer to be able to see the contents of a shadow area, but if they do, then we need to adjust the exposure to bring some detail back into those mysterious shadowy portions of the image.
Restoring shadow clipping is simple, using exposure compensation you simply increase the exposure until the shadows come back within the limits of the histogram.
Good exposure
Good exposure, as far as I’m concerned, is an image where I’ve managed to capture as much detail as possible at the time of taking the photo. This allows me to stylistically edit the image as I please when I get home, without the need to do any heavy lifting to recover blown highlights or blocked up shadows.
It’s generally easy to recover bright highlight detail than it is to recover deep shadow detail. Shadow areas of images, when brightened, always contain noise, and noise is something I’m never keen on trying to fix, because ultimately the fix is destructive and results in a loss of sharpness when the software smoothes out the grain.
With this hatred of shadow in mind (or more accurately, the hatred of recovering them in Photoshop), I always expose my images so that the histogram is biased towards the right, but at the same time avoiding the clipping of highlights (represented by the bunching up the right edge of the histogram.) This method means I can deepen the shadows to black later if I want, but if I want to retain the information in the darker shadow areas of the image, I can, without introducing noise. You may have already heard the term “expose right”? Well, that’s what I do, and this is all it means.
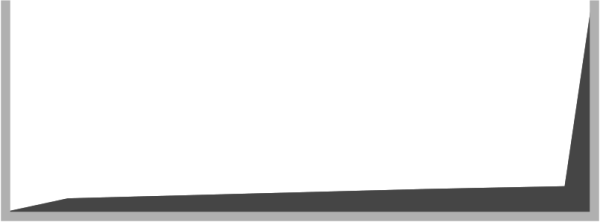
When I’m happy with an image, my histogram will typically look something like this:
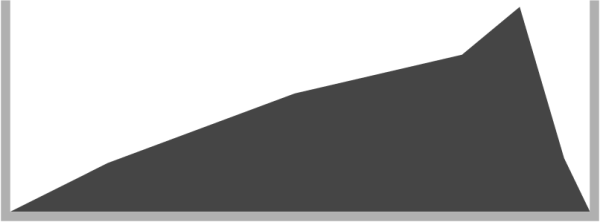
Getting my histogram to look like this where possible makes me a happy chap! There is no bunching of pixels in the shadows or the highlights, meaning that information in the bright and dark areas of the image have been retained. In the middle we have lots of information about everything between black and white (referred to as “mid tones”).
Caveats
It’s important to remember that the histogram is a guide, and as such doesn’t mean that a perfectly balanced exposure is correct, or even desired, for every image you’re likely to take. There are times where you may wish to deliberately underexpose your image for mood, or overexpose to create a low contrast, high-key image.
There will be times when it will be impossible to avoid highlight clipping — when you take a photo with the sun in it. There will be times where shadow clipping will be unavoidable — night shots being a good example.
Simply use the histogram to ensure you capture the detail you need in your finished image, because there is nothing more tedious than having to fix exposure problems in Photoshop, and there’s absolutely nothing worse than an otherwise perfect image being destroyed because you never bothered to take a second to check your histogram!